How to Debug and Troubleshoot Errors
There are several ways to identify and resolve errors.
Console
If something is not working, you can use console.log() to check if the relevant part of the code is functioning correctly.
How to open the console
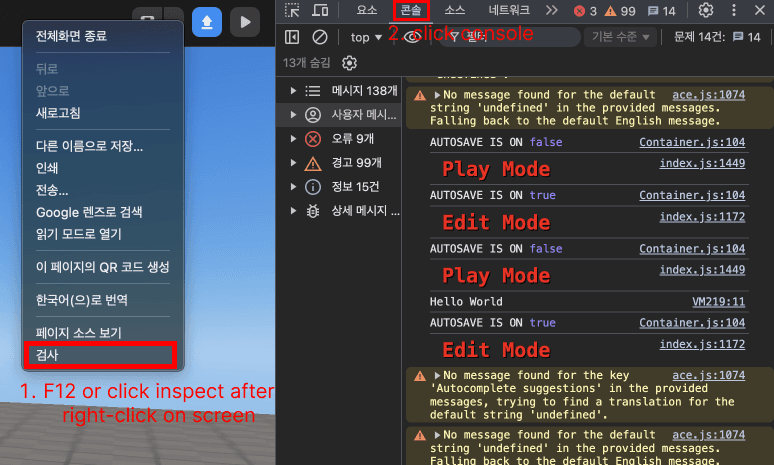 Press F12 or right-click on the browser screen and select Inspect > Select the Console tab in the top of the opened console window
Note
- Checking the console after an error occurs may not display the error’s details. To see the error details in real-time, test the game with the console window open.
- Some errors displayed in the console may not be related to the Redbrick engine or may not affect gameplay. Not every error message in the console indicates a problem.


Error Popups
🚫
Error Popup
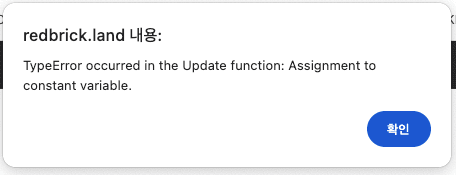 Error popup displayed when an error occurs
Note
Error popups do not always appear when an error occurs.
If no error popup is displayed, check the console window.
Save and Reopen the Project
If you believe everything is correct and cannot find the error, use the “Save as File” option to save the project as a .json file.
Then create a new project and use “Open from File” to load the saved file.
Finally, run the project again to see if the issue is resolved.
If it still doesn’t work, reach out through the Discord channel.